Celebrating 30 Years of the Salmonberry River Data Collection: Temperature

By Ian Fergusson
Joyce Sherman already provided a history of the monitoring program in the Salmonberry. As part of that program, we started monitoring temperatures in 1993, and continued through 1997. The idea was to establish a baseline of summer water temperatures for future comparison. The 1993 results were not useable due to a clerical mishap. Mother Nature threw us a curve in February 1996, with a rain-on-snow event that caused debris flows in several tributaries where we had been collecting data. The flood scoured some channels to bedrock, and removed riparian vegetation from long stretches. This caused temperatures to increase significantly in the affected tributaries, an effect that was reinforced by the December 2007 flood and still persists today. Our “baseline” turned out to be 1994 and 1995, and who knows if those years were “normal,” if there is such a thing? The Salmonberry has a long history of disturbance: the PR&N Railroad was completed in 1912, facilitating logging of the watershed. The railroad followed the river closely, with fill and rip-rap constricting flow, and washouts depositing fine sediment. Large stands of old-growth forests in the Salmonberry were destroyed in the Tillamook Burns in 1933 and 1945. Major road construction and salvage logging followed the fires. After a 40- to 50-year period of relative quiet, logging resumed when the replanted trees began to reach harvestable size.
The Oregon Department of Fish and Wildlife (ODFW) asked us to place temperature loggers again in 2004. That turned out to be a very low-water year, and several monitors in the upper watershed went dry. Starting in 2007, the project team decided to start monitoring every year. A donation of temperature loggers from ODFW, and subsequent STEP/STAC grants, allowed us to expand the effort and update the loggers. The summer of 2022 will be the 16th consecutive year, and the 21st overall, of temperature monitoring in the Salmonberry. We’ve increased the coverage from 10 sites (1994-2008) to 14 sites (2009-2018) to 17 sites (2019+).
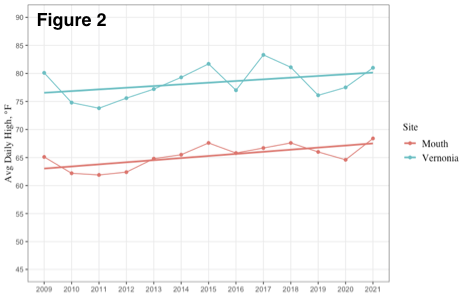
There are many factors driving water temperatures at localized and watershed scales, with solar radiation being the primary one. Salmonberry water temperatures track closely with regional air temperatures, as measured at the USGS weather station at Vernonia. Both show increasing trends in maximum daily temperature. Figure 2 shows average daily high temperatures at Vernonia and the Salmonberry mouth, using the latest common start date (June 20) and the earliest common end date (Sep 5) since 2009, when the site at the mouth (RM 0.18) was established.
The loggers used from 1994 to 1997 and again in 2004 were programmed by ODFW to record temperatures 10 times a day, or every 2.4 hours. This was due to battery and data storage limitations. The loggers we used from 2007 through 2015 allowed sampling every 2 hours. The loggers in use since 2016 allow sampling every 30 minutes. The greater the interval between readings, the more likely the logger is to understate the actual high temperature, and overstate the actual minimum temperature, for any given day. The result is that our earlier records probably show lower maximum temperatures than what actually occurred, making trend lines look steeper than they might otherwise. Nevertheless, these discrepancies do not invalidate the conclusion that temperatures are increasing over time; it is the rate of increase prior to 2009 that is less certain.
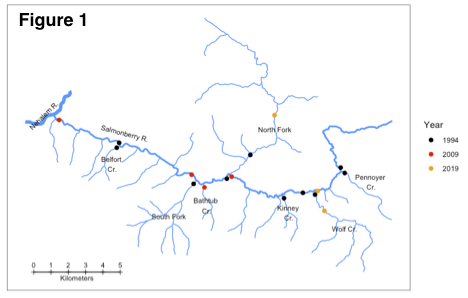
There are many ways to summarize temperature records. One is to use average daily high temperatures over a given period, such as shown above. Another way is to calculate the average maximum over a running seven-day period, commonly abbreviated 7DADM. This method has been adopted by the EPA and Oregon DEQ to establish temperature standards for fish use. The Salmonberry has been designated as “core cold water habitat” for salmonids, which means that the 7DADM should not exceed 16°C (60.8°F). The lower main stem has exceeded that standard every year for which we have data, in some years exceeding the standard for the entire summer. In very hot years, such as 2015, 2018, and 2021, the 16°C standard can be exceeded as far up in the watershed as we have monitors (see Figure 1, and the orange markers placed in 2019). In practical terms, as temperature impairment goes farther up the watershed, there is less suitable habitat available for rearing juvenile salmonids. As temperatures warm, diseases and infections become more likely. To a point, fish can grow faster in warmer waters, but if food is limited (as is likely in most coastal streams), higher metabolic rates can cause additional stress.
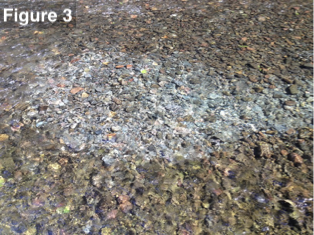
Another important temperature standard relates to spawning. The EPA/DEQ standard for salmonid spawning says that the 7DADM during spawning periods shall not exceed 13°C (55.4°F). Above that level increased egg mortality, inhibited alevin development, and negative effects on egg maturation can occur. There is an early fall spawning run of Chinook still hanging on in the Salmonberry, though in small numbers. Figure 3 shows a photo of a Chinook redd from September 27, 2014, and a “rapid bioassessment survey” (RBA) of the Nehalem basin noted an adult chinook holding in a pool in the lower Salmonberry on September 3, 2018. The maximum 7DADM for September 2014 was 18.1°C (64.6°F), and it was 18.3°C (64.9°F) in September 2018, both well above the spawning temperature standard. In fact, maximum 7DADM temperatures have equaled or exceeded the 13°C standard in September every year at all main stem sites as far up as RM 12.1, and in 12 of 19 years, including all of the last 9 years, at the uppermost main stem site at RM 13.9. Water temperature is clearly a limiting factor for early-spawning fall chinook in the Salmonberry, as there appears to be no area they can access in September that has temperatures appropriate for healthy spawning.
In order to reach the Salmonberry, fall Chinook have to ascend 22 miles of the Nehalem main stem, enduring high temperatures and low oxygen levels. The Nehalem has a DEQ 303d impaired status for temperature (RM 0-92.4) and dissolved oxygen (RM 0-36.2). In the Nehalem basin RBA, the Nehalem temperature was 22.1°C at 10:45 AM on July 27, 2018. The Salmonberry plume at that time harbored approximately 250 cutthroat trout and had a temperature of 18°C. Technically, in spite of its own temperature impairment, the Salmonberry qualifies as an EPA/DEQ “cold water refuge” by virtue of being at least 2°C cooler than the Nehalem. Continued temperature monitoring of the Salmonberry is important to ensure that its role as a temperature refuge is maintained.
One of the temperature monitoring locations in the Salmonberry. NFS Photo.
One of the temperature monitoring locations in the Salmonberry. NFS Photo.
One of the temperature monitoring locations in the Salmonberry. NFS Photo.